Improved alignment and segmentation tools have now been released in the latest version of Scanbox, while retaining much of the functionality of the last version.
sbxaligntool. The new alignment tool, shown below, adds batch processing of files, including the processing of eye and ball motion if those data are present. A region-of-interest (ROI) can optionally be selected manually or automatically. For file entries where manual selection was specified, the program will stop and present a rectangle on the screen for the user to specify the ROI. Typically, automatic ROI works fine, and it does not require the user to stand by the computer to specify the ROI each time a new file starts to process.

As the files are aligned, the Status column and Status message will display the progress. The alignment procedure can also be visualized by clicking the Live update checkbox, which will display the mean of the entire image stack as the process moves along. Pan and Zoom buttons allow the user to inspect details in the live image, such as fine branches, as the system is carrying out the alignment. This tool performs rigid alignment and the result is stored in a *_rigid.sbx file. The original data is left untouched. The tool can align images relatively fast (about 65 frames/sec in my computer), but it will take a few minutes to compute the reference image if the sequence is 15 min or more (please be patient). Alignment improves with the number of passes requested. Usually one pass is very good, but you can try two or more passes by changing the appropriate entry in the column. The alignment algorithm has been improved.
sbxsegmenttool. The segmentation tool works in a similar way as before. After loading the aligned *_rigid.sbx file, it will display the correlation map. Segmentation then proceeds as in the previous version.
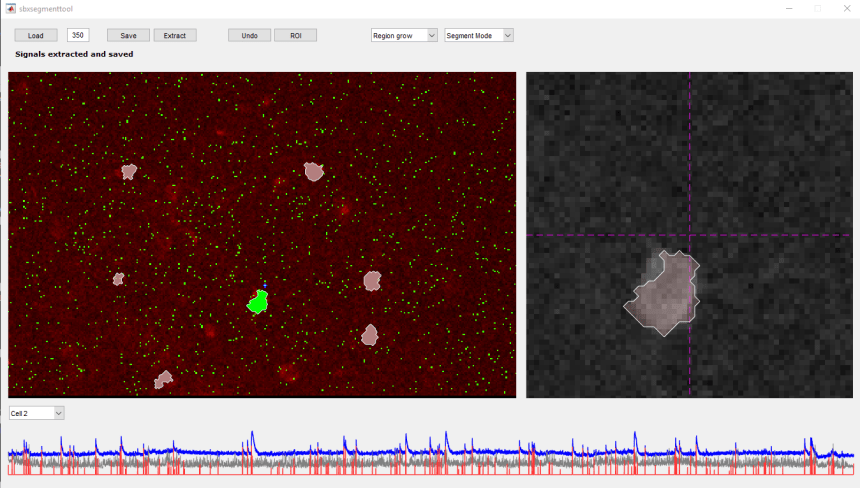
Once a number of cells are selected, you must save the segmentation and then extract the signals by pressing the corresponding buttons. After the signals are extracted you can select a cell with the pull down menu on the bottom left and the traces corresponding to that cell (now highlighted in green) will be displayed. The blue trace represents the average signal within the cell, the gray trace is the neuropil, and the trace is the estimated spike rate using the Vanilla algorithm with parameters optimized for GCaMP6f.
Improvements include an Undo button, which will remove the last cell segmented. The ability to load a previous segmentation (it will load automatically after you select the *_rigid.sbx file), to continue adding cells to it. The ability to define a ROI in the correlation map to automatically increase the contrast of the correlation map as the most salient cells are selected. A zoomed version of the mean image on the right to go along with the correlation map. And the tool now saves the neuropil and deconvolved signal as well.
Give these tools a try. Report back any suggestions for improvements or problems you encounter.

Thank you for the batch alignment tool! I’m curious why you dropped the option to specify the alignment method? Is the new version of the rigid alignment always performing better than any of the others? Is there a way to run the batch alignment with another method from the old sbxaligntool?
Hi Barna. We find that the new version of rigid alignment is very fast (about 50frames/sec on my machine) much better than the earlier version. So we saw no need so far to invoke the non-rigid alignment, which ran much slower. But I can bring it back if there is a need (it is still there sitting in the code… just not being called).